11  Summarizing Data

“What we have is a data glut.” — Vernor Vinge, Professor Emeritus of Mathematics, San Diego State University

As datasets grow in size and complexity, the ability to summarize information becomes an essential skill in any data scientist’s toolkit. Summary statistics—like averages, medians, and group-level comparisons—help us cut through the noise and uncover meaningful patterns. Whether you’re reporting results to stakeholders or exploring data to form new hypotheses, knowing how to aggregate data is fundamental.

NoneDo This First!

To begin this lesson, open the Ames Housing dataset and take a few minutes to explore it. What kinds of summary questions come to mind? Consider what a homeowner, real estate agent, or city planner might want to know. For example:

  • Which neighborhood has the highest median sale price?
  • How does the number of bedrooms relate to the average or median sale price?
  • What’s the average sale price per square foot?
  • Are there any neighborhoods with notably low or high prices?
import pandas as pd

ames = pd.read_csv('../data/ames_raw.csv')
ames.head()
Order PID MS SubClass MS Zoning Lot Frontage Lot Area Street Alley Lot Shape Land Contour ... Pool Area Pool QC Fence Misc Feature Misc Val Mo Sold Yr Sold Sale Type Sale Condition SalePrice
0 1 526301100 20 RL 141.0 31770 Pave NaN IR1 Lvl ... 0 NaN NaN NaN 0 5 2010 WD Normal 215000
1 2 526350040 20 RH 80.0 11622 Pave NaN Reg Lvl ... 0 NaN MnPrv NaN 0 6 2010 WD Normal 105000
2 3 526351010 20 RL 81.0 14267 Pave NaN IR1 Lvl ... 0 NaN NaN Gar2 12500 6 2010 WD Normal 172000
3 4 526353030 20 RL 93.0 11160 Pave NaN Reg Lvl ... 0 NaN NaN NaN 0 4 2010 WD Normal 244000
4 5 527105010 60 RL 74.0 13830 Pave NaN IR1 Lvl ... 0 NaN MnPrv NaN 0 3 2010 WD Normal 189900

5 rows × 82 columns

These types of questions will guide your thinking as we explore tools in Pandas for summarizing and grouping data. And by the end of this lesson, you will be able to:

Note📓 Follow Along in Colab!

As you read through this chapter, we encourage you to follow along using the companion notebook in Google Colab (or other editor of choice). This interactive notebook lets you run code examples covered in the chapter—and experiment with your own ideas.

👉 Open the Manipulating Data Notebook in Colab.

11.1 Simple aggregation

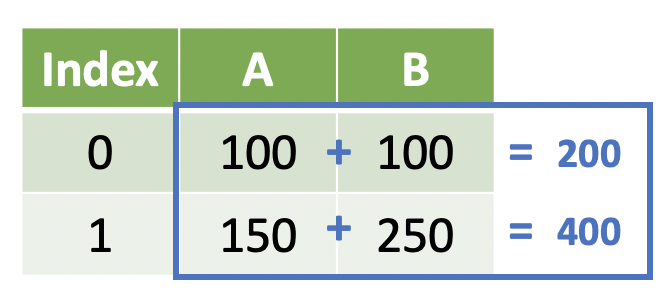
In the previous lesson, we learned how to manipulate data across columns, typically by performing operations on two or more Series within the same row. For example, we might calculate a total by adding two columns together:

These types of operations return the same number of rows as the original DataFrame. This is sometimes called a window function—but you can think of it as performing calculations at the row level.

For example, we can calculate a total by adding two columns together with code that looks like this:

DataFrame['A'] + DataFrame['B']

This adds the values in column A to the corresponding values in column B, row by row. You could also use other operators (e.g., subtraction, multiplication) as long as the result returns one value per row.

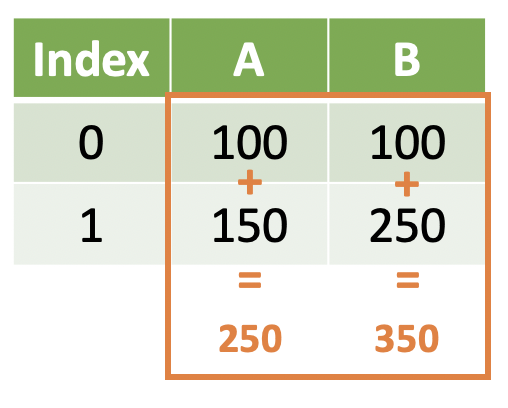
However, sometimes we want to shift our focus from individual rows to the entire column. Instead of computing values across columns within a row, we want to aggregate values across rows within a column. This is the foundation of many summary statistics—like computing the average, median, or maximum of a column.

These types of operations return a single value that summarizes multiple values. This is often referred to as a summary function, but you can think of it as aggregating values across rows.

Summarizing a Series

Once we’ve loaded a dataset into a Pandas DataFrame, one of the simplest ways to explore it is by summarizing individual columns—also known as Series. Pandas makes this easy with built-in methods like .sum(), .mean(), and .median().

Suppose we want to compute the total of all home sale prices. We can do that by selecting the SalePrice column and using the .sum() method:

ames['SalePrice'].sum()
np.int64(529732456)

This returns a single value, which makes this a summary operation—we’re aggregating values across all rows in the SalePrice column.

Pandas includes many other helpful summary methods for numerical data:

# Average sale price
ames['SalePrice'].mean()
np.float64(180796.0600682594)
# Median sale price
ames['SalePrice'].median()
np.float64(160000.0)
# Standard deviation of sale prices
ames['SalePrice'].std()   
np.float64(79886.692356665)

These methods are designed for quantitative variables and won’t work as expected on text-based columns.

Pandas will include the data type in the summary statistic output preceeding the actual summary stat (i.e. np.float64). If you want to not see that you can just wrap it with print():

print(ames['SalePrice'].sum())
529732456

However, Pandas also provides summary methods that are useful for categorical variables (like neighborhood names):

# Number of unique neighborhoods
ames['Neighborhood'].nunique()
28
# Most frequent neighborhood
ames['Neighborhood'].mode()    
0    NAmes
Name: Neighborhood, dtype: object

These allow us to summarize the structure and frequency of categorical data—just as we do with numbers.

Knowledge Check

NoneTry it yourself:
  1. What is the difference between a window operation and a summary operation?
  2. What are the mean, median, and standard deviation of the Gr Liv Area (above ground square footage)?
  3. How many times does each neighborhood appear in the dataset? (Hint: Try using the GenAI code assistant to figure this out. Ask it how to “count value frequency in a Pandas Series.”). Then reflect: Would this count as a summary operation? Why or why not?

The describe() Method

When you’re first getting familiar with a dataset, it’s helpful to quickly view a variety of summary statistics all at once. Pandas provides the .describe() method for exactly this purpose.

For numeric variables, .describe() returns common summary statistics such as the count, mean, standard deviation, min, and max values:

ames['SalePrice'].describe()
count      2930.000000
mean     180796.060068
std       79886.692357
min       12789.000000
25%      129500.000000
50%      160000.000000
75%      213500.000000
max      755000.000000
Name: SalePrice, dtype: float64

This is especially useful during exploratory data analysis (EDA) when you’re trying to get a sense of a column’s range, distribution, and central tendency.

The behavior of .describe() changes based on the data type of the Series.

For categorical variables, .describe() provides a different summary, showing the number of non-null entries, number of unique values, most frequent value, and its frequency:

ames['Neighborhood'].describe()
count      2930
unique       28
top       NAmes
freq        443
Name: Neighborhood, dtype: object

In both cases, .describe() gives you a quick and informative overview—whether you’re working with numbers or categories.

Summarizing a DataFrame

So far, we’ve focused on summarizing individual columns (Series). But in many cases, we want to explore multiple variables at once. Fortunately, Pandas allows us to apply the same summary methods to a subset of columns in a DataFrame.

First, recall how to select multiple columns using double brackets and a list of column names:

ames[['SalePrice', 'Gr Liv Area']]
SalePrice Gr Liv Area
0 215000 1656
1 105000 896
2 172000 1329
3 244000 2110
4 189900 1629
... ... ...
2925 142500 1003
2926 131000 902
2927 132000 970
2928 170000 1389
2929 188000 2000

2930 rows × 2 columns

This returns a new DataFrame with just the SalePrice and Gr Liv Area columns.

We can now apply summary methods—just like we did with a single Series:

ames[['SalePrice', 'Gr Liv Area']].mean()
SalePrice      180796.060068
Gr Liv Area      1499.690444
dtype: float64
ames[['SalePrice', 'Gr Liv Area']].median()
SalePrice      160000.0
Gr Liv Area      1442.0
dtype: float64

These methods return a Series object, where:

  • The index contains the column names, and
  • The values are the summary statistics (e.g., mean or median) for each column.

This approach is useful when you’re interested in comparing summary values across several numeric variables at once.

Even though you’re summarizing multiple columns, each summary method still operates column-by-column under the hood.

The .agg() Method

So far, we’ve used built-in summary methods like .mean() and .median() to compute statistics on one or more columns. While this approach works well, it has a few important limitations when applied to DataFrames:

  1. You can only apply one summary method at a time.
  2. The same method gets applied to every selected column.
  3. The result is returned as a Series, which can be harder to work with later.

To overcome these limitations, Pandas provides a more flexible tool: the .agg() method (short for .aggregate()).

Here’s a basic example:

ames.agg({
    'SalePrice': ['mean']
})
SalePrice
mean 180796.060068

This returns a DataFrame rather than a Series—and gives us more control over how we summarize each column.

Let’s break it down:

  • We pass a dictionary to .agg()
  • The keys are column names
  • The values are lists of summary functions we want to apply

The .agg() method is just shorthand for .aggregate(). You can use either version—they’re equivalent!

# Verbose version
ames.aggregate({
    'SalePrice': ['mean']
})

# Concise version
ames.agg({
    'SalePrice': ['mean']
})
SalePrice
mean 180796.060068

We can easily extend this to include multiple columns:

ames.agg({
    'SalePrice': ['mean'],
    'Gr Liv Area': ['mean']
})
SalePrice Gr Liv Area
mean 180796.060068 1499.690444

And because the values in the dictionary are lists, we can apply multiple summary functions to each column:

ames.agg({
    'SalePrice': ['mean', 'median'],
    'Gr Liv Area': ['mean', 'min']
})
SalePrice Gr Liv Area
mean 180796.060068 1499.690444
median 160000.000000 NaN
min NaN 334.000000

You don’t have to apply the same summary functions to every variable. If a summary function isn’t applied to a particular column, Pandas will return a NaN in that spot.

The .agg() method is especially useful when you want to apply different aggregations to different columns and get the results in a clean, tabular format.

Knowledge Check

NoneTry it yourself:
  1. Fill in the blanks to compute the average number of rooms above ground (TotRms AbvGrd) and the average number of bedrooms above ground (Bedroom AbvGr). What type of object is returned?

    ames[['______', '______']].______()
  2. Use the .agg() method to complete the same computation as above. How does the output differ?

  3. Fill in the blanks in the below code to calculate the minimum and maximum year built (Year Built) and the mean and median number of garage stalls (Garage Cars):

    ames.agg({
        '_____': ['min', '_____'],
        '_____': ['_____', 'median']
    })

The describe() Method

While .agg() is a powerful and flexible tool for customized summaries, the .describe() method offers a quick and convenient overview of your entire DataFrame—making it especially useful during exploratory data analysis (EDA).

Try running .describe() on the full Ames dataset:

ames.describe()
Order PID MS SubClass Lot Frontage Lot Area Overall Qual Overall Cond Year Built Year Remod/Add Mas Vnr Area ... Wood Deck SF Open Porch SF Enclosed Porch 3Ssn Porch Screen Porch Pool Area Misc Val Mo Sold Yr Sold SalePrice
count 2930.00000 2.930000e+03 2930.000000 2440.000000 2930.000000 2930.000000 2930.000000 2930.000000 2930.000000 2907.000000 ... 2930.000000 2930.000000 2930.000000 2930.000000 2930.000000 2930.000000 2930.000000 2930.000000 2930.000000 2930.000000
mean 1465.50000 7.144645e+08 57.387372 69.224590 10147.921843 6.094881 5.563140 1971.356314 1984.266553 101.896801 ... 93.751877 47.533447 23.011604 2.592491 16.002048 2.243345 50.635154 6.216041 2007.790444 180796.060068
std 845.96247 1.887308e+08 42.638025 23.365335 7880.017759 1.411026 1.111537 30.245361 20.860286 179.112611 ... 126.361562 67.483400 64.139059 25.141331 56.087370 35.597181 566.344288 2.714492 1.316613 79886.692357
min 1.00000 5.263011e+08 20.000000 21.000000 1300.000000 1.000000 1.000000 1872.000000 1950.000000 0.000000 ... 0.000000 0.000000 0.000000 0.000000 0.000000 0.000000 0.000000 1.000000 2006.000000 12789.000000
25% 733.25000 5.284770e+08 20.000000 58.000000 7440.250000 5.000000 5.000000 1954.000000 1965.000000 0.000000 ... 0.000000 0.000000 0.000000 0.000000 0.000000 0.000000 0.000000 4.000000 2007.000000 129500.000000
50% 1465.50000 5.354536e+08 50.000000 68.000000 9436.500000 6.000000 5.000000 1973.000000 1993.000000 0.000000 ... 0.000000 27.000000 0.000000 0.000000 0.000000 0.000000 0.000000 6.000000 2008.000000 160000.000000
75% 2197.75000 9.071811e+08 70.000000 80.000000 11555.250000 7.000000 6.000000 2001.000000 2004.000000 164.000000 ... 168.000000 70.000000 0.000000 0.000000 0.000000 0.000000 0.000000 8.000000 2009.000000 213500.000000
max 2930.00000 1.007100e+09 190.000000 313.000000 215245.000000 10.000000 9.000000 2010.000000 2010.000000 1600.000000 ... 1424.000000 742.000000 1012.000000 508.000000 576.000000 800.000000 17000.000000 12.000000 2010.000000 755000.000000

8 rows × 39 columns

By default, Pandas will summarize only the numeric columns, returning statistics like count, mean, standard deviation, min, max, and quartiles.

But wait, what’s missing from the output?

String (object) columns — like Neighborhood — are excluded!

If you want to include other variable types, you can use the include parameter to tell Pandas what to summarize. For example:

ames.describe(include=['int', 'float', 'object'])
Order PID MS SubClass MS Zoning Lot Frontage Lot Area Street Alley Lot Shape Land Contour ... Pool Area Pool QC Fence Misc Feature Misc Val Mo Sold Yr Sold Sale Type Sale Condition SalePrice
count 2930.00000 2.930000e+03 2930.000000 2930 2440.000000 2930.000000 2930 198 2930 2930 ... 2930.000000 13 572 106 2930.000000 2930.000000 2930.000000 2930 2930 2930.000000
unique NaN NaN NaN 7 NaN NaN 2 2 4 4 ... NaN 4 4 5 NaN NaN NaN 10 6 NaN
top NaN NaN NaN RL NaN NaN Pave Grvl Reg Lvl ... NaN Ex MnPrv Shed NaN NaN NaN WD Normal NaN
freq NaN NaN NaN 2273 NaN NaN 2918 120 1859 2633 ... NaN 4 330 95 NaN NaN NaN 2536 2413 NaN
mean 1465.50000 7.144645e+08 57.387372 NaN 69.224590 10147.921843 NaN NaN NaN NaN ... 2.243345 NaN NaN NaN 50.635154 6.216041 2007.790444 NaN NaN 180796.060068
std 845.96247 1.887308e+08 42.638025 NaN 23.365335 7880.017759 NaN NaN NaN NaN ... 35.597181 NaN NaN NaN 566.344288 2.714492 1.316613 NaN NaN 79886.692357
min 1.00000 5.263011e+08 20.000000 NaN 21.000000 1300.000000 NaN NaN NaN NaN ... 0.000000 NaN NaN NaN 0.000000 1.000000 2006.000000 NaN NaN 12789.000000
25% 733.25000 5.284770e+08 20.000000 NaN 58.000000 7440.250000 NaN NaN NaN NaN ... 0.000000 NaN NaN NaN 0.000000 4.000000 2007.000000 NaN NaN 129500.000000
50% 1465.50000 5.354536e+08 50.000000 NaN 68.000000 9436.500000 NaN NaN NaN NaN ... 0.000000 NaN NaN NaN 0.000000 6.000000 2008.000000 NaN NaN 160000.000000
75% 2197.75000 9.071811e+08 70.000000 NaN 80.000000 11555.250000 NaN NaN NaN NaN ... 0.000000 NaN NaN NaN 0.000000 8.000000 2009.000000 NaN NaN 213500.000000
max 2930.00000 1.007100e+09 190.000000 NaN 313.000000 215245.000000 NaN NaN NaN NaN ... 800.000000 NaN NaN NaN 17000.000000 12.000000 2010.000000 NaN NaN 755000.000000

11 rows × 82 columns

This will generate descriptive statistics for all numeric and categorical variables, including counts, unique values, top categories, and their frequencies.

You can also use include='all' to summarize every column, regardless of type. Just be aware that this can result in a mix of numeric and non-numeric statistics in the same table.

The .describe() method is a fast and effective way to get a high-level snapshot of your dataset—perfect for early-stage data exploration.

11.2 Grouped Aggregation

So far, we’ve focused on summary operations that collapse an entire column—or a subset of columns—into a single result. But in many real-world analyses, we’re interested in summarizing within groups rather than across the whole dataset.

This is called a grouped aggregation. Instead of collapsing a DataFrame into a single row, we collapse it into one row per group.

For example, we might want to compute:

  • Total home sales by neighborhood
  • Average square footage by number of bedrooms
  • Median sale price by year
  • Maximum temperature by month

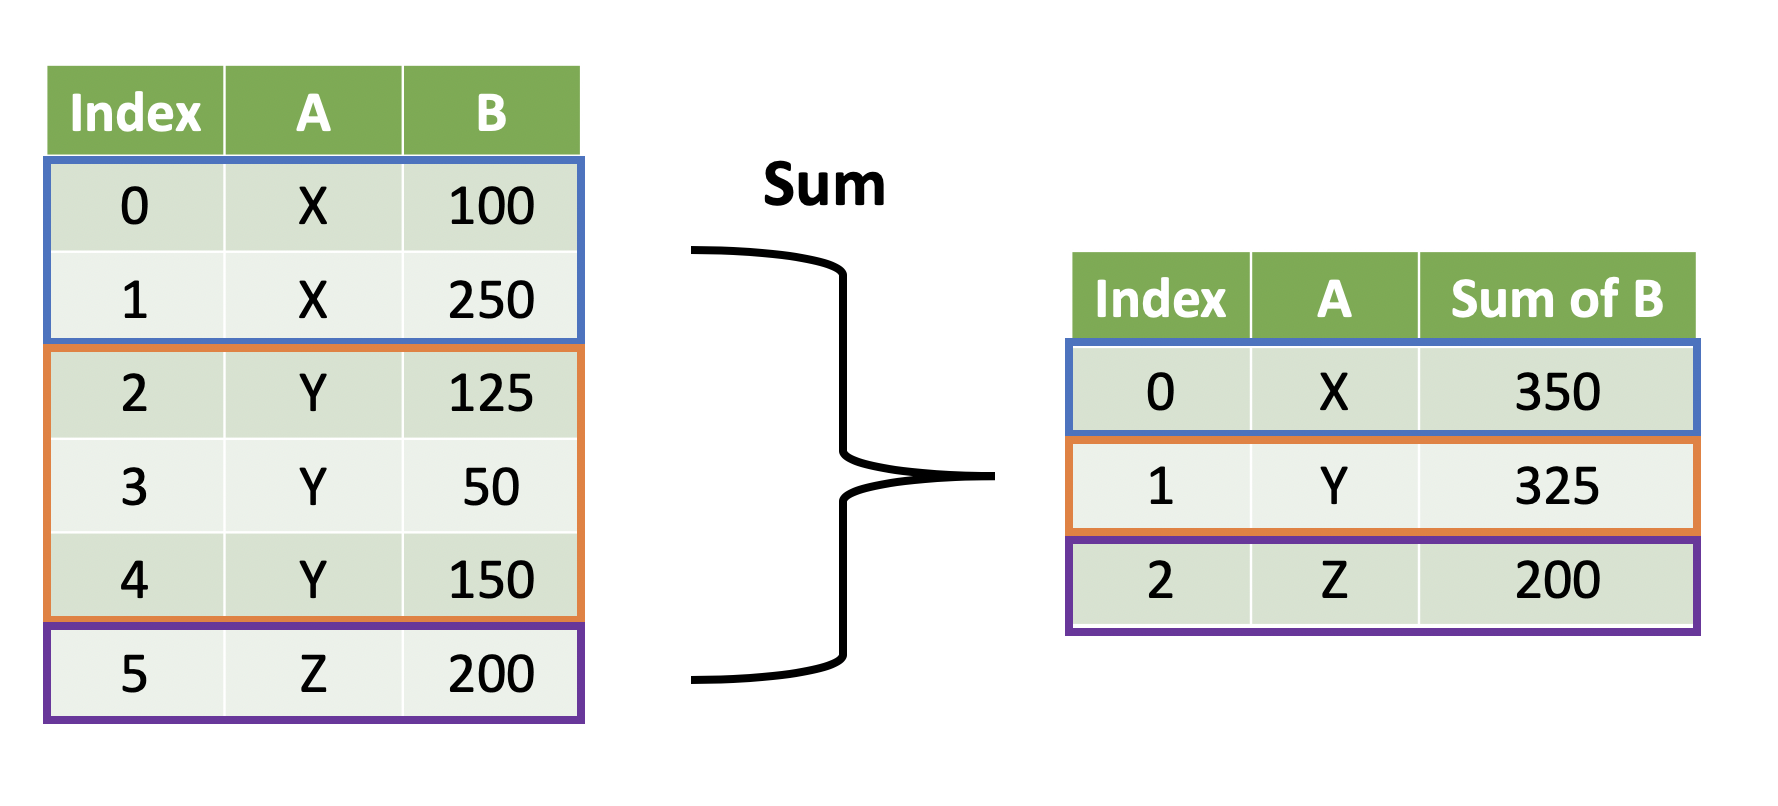
Here’s a simple illustration: suppose we want to compute the sum of column B for each unique category in column A:

The Groupby Model

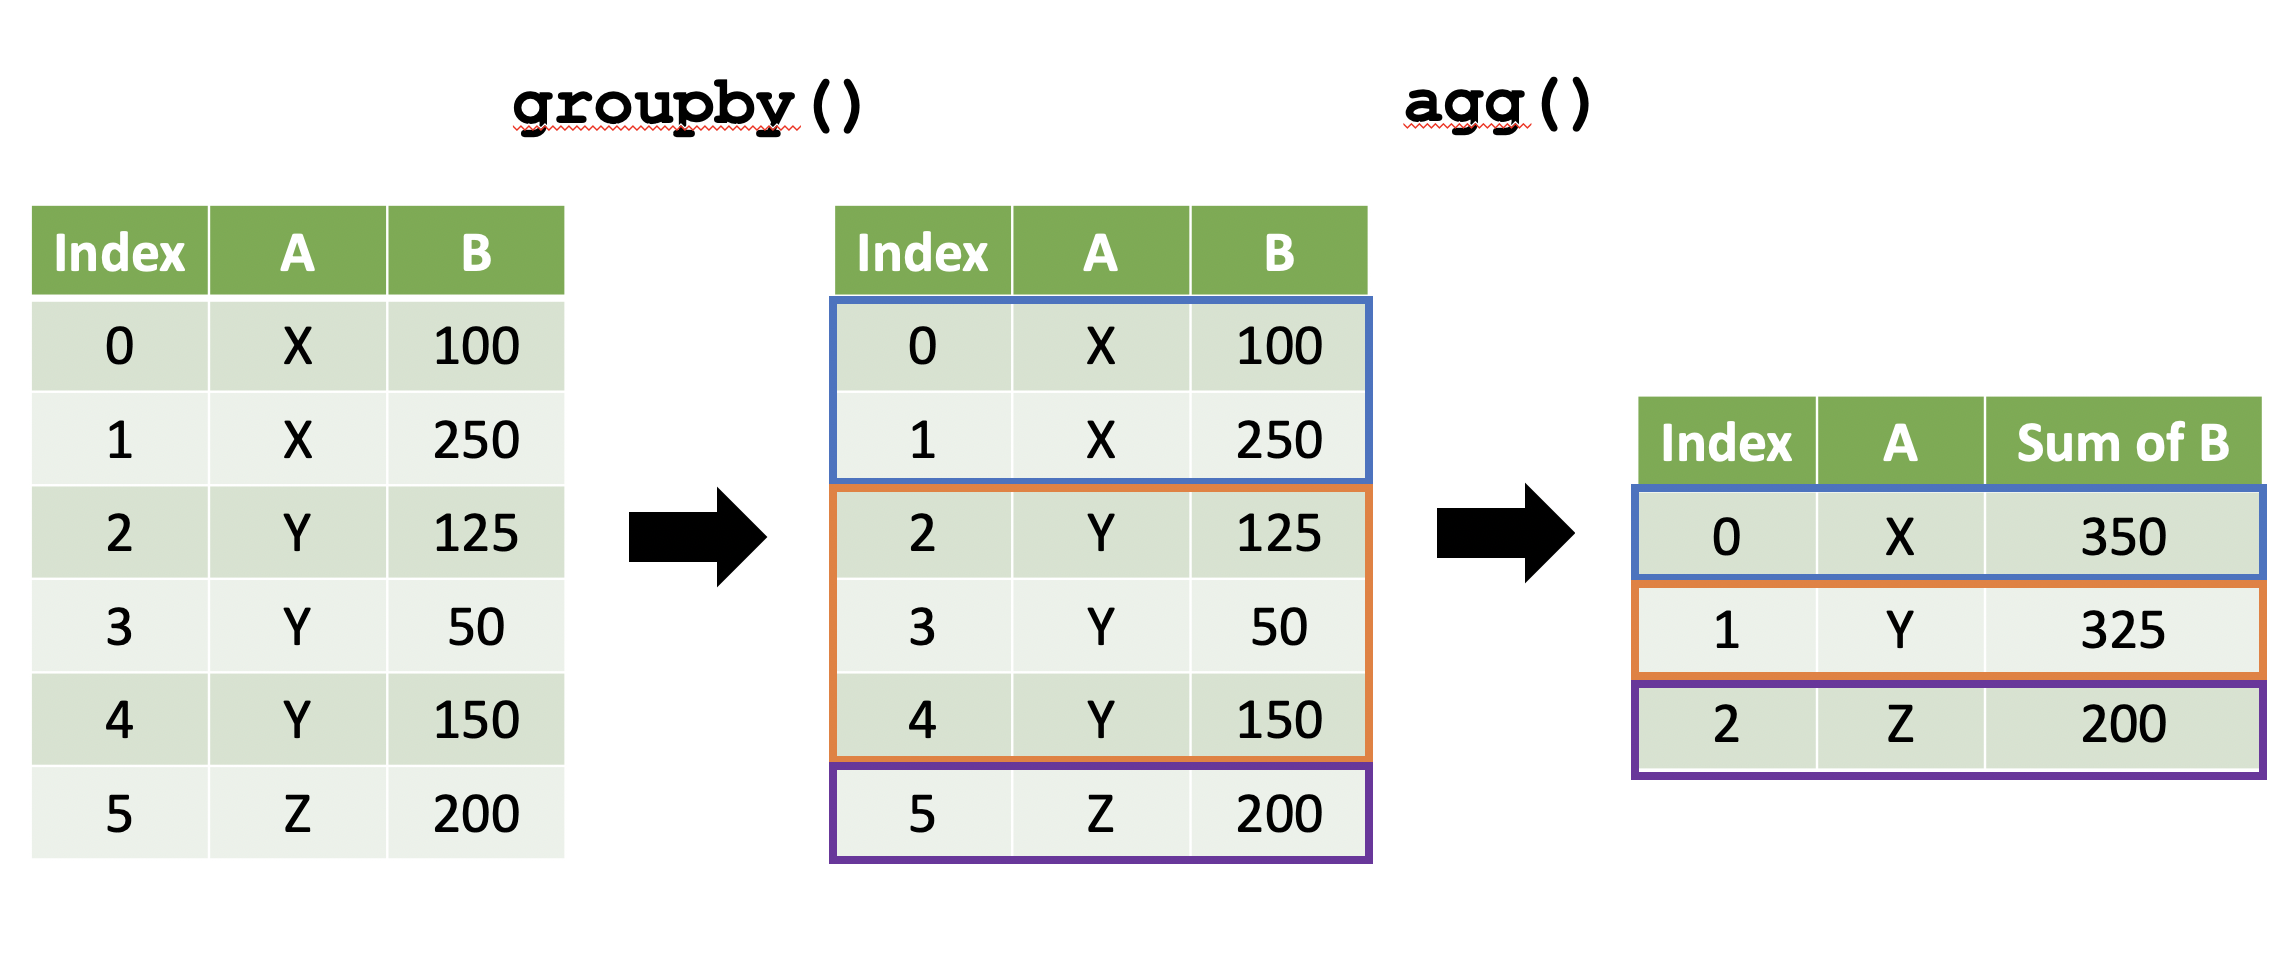
Grouped aggregation in Pandas always follows the same three-step process:

  1. Group the data using groupby()
  2. Apply a summary method like .sum(), .agg(), or .describe()
  3. Return a DataFrame of group-level summaries

Creating a Grouped Object

We use the groupby() method to define how we want to group the data. For example, to group homes by Neighborhood:

ames_grp = ames.groupby('Neighborhood')

This creates a GroupBy object—it doesn’t return a DataFrame yet, but rather an internal structure that maps each group to its corresponding rows.

type(ames_grp)
pandas.core.groupby.generic.DataFrameGroupBy

You can inspect the structure of the groups:

ames_grp.groups
{'Blmngtn': [52, 53, 468, 469, 470, 471, 472, 473, 1080, 1081, 1082, 1083, 1084, 1741, 1742, 1743, 1744, 2419, 2420, 2421, 2422, 2423, 2424, 2425, 2426, 2427, 2428, 2429], 'Blueste': [298, 299, 932, 933, 934, 935, 1542, 1543, 2225, 2227], 'BrDale': [29, 30, 31, 402, 403, 404, 405, 406, 407, 1039, 1040, 1041, 1042, 1043, 1044, 1045, 1675, 1676, 1677, 1678, 1679, 2364, 2365, 2366, 2367, 2368, 2369, 2370, 2371, 2372], 'BrkSide': [129, 130, 191, 192, 193, 194, 195, 196, 197, 198, 199, 614, 615, 728, 729, 730, 731, 732, 733, 734, 735, 736, 737, 738, 739, 740, 741, 742, 743, 744, 745, 746, 747, 748, 1219, 1220, 1221, 1222, 1327, 1328, 1329, 1330, 1331, 1332, 1333, 1334, 1335, 1336, 1337, 1338, 1339, 1340, 1341, 1342, 1343, 1344, 1345, 1348, 1349, 1350, 1351, 1352, 1353, 1354, 1355, 1901, 1902, 1903, 1904, 2005, 2006, 2007, 2008, 2009, 2010, 2011, 2012, 2013, 2014, 2015, 2016, 2017, 2018, 2019, 2020, 2022, 2023, 2024, 2025, 2554, 2555, 2556, 2557, 2670, 2671, 2672, 2673, 2675, 2676, 2677, ...], 'ClearCr': [208, 209, 210, 228, 229, 232, 233, 255, 779, 781, 782, 785, 833, 834, 1374, 1392, 1395, 1398, 1399, 1400, 1401, 1402, 1406, 1429, 1430, 2045, 2071, 2072, 2073, 2077, 2115, 2116, 2117, 2118, 2701, 2725, 2726, 2727, 2730, 2731, 2764, 2765, 2766, 2767], 'CollgCr': [249, 250, 251, 252, 256, 257, 258, 259, 260, 261, 262, 263, 264, 265, 266, 267, 268, 269, 270, 271, 272, 818, 819, 820, 821, 822, 823, 824, 825, 826, 827, 828, 829, 830, 831, 835, 836, 837, 838, 839, 840, 841, 842, 843, 844, 845, 846, 847, 848, 849, 850, 851, 852, 853, 854, 855, 856, 857, 858, 859, 860, 861, 862, 863, 864, 865, 866, 867, 868, 869, 870, 871, 872, 873, 874, 875, 876, 877, 878, 879, 880, 881, 882, 883, 1423, 1424, 1425, 1426, 1431, 1432, 1433, 1434, 1435, 1436, 1437, 1438, 1439, 1440, 1441, 1442, ...], 'Crawfor': [293, 294, 295, 296, 297, 300, 308, 912, 915, 917, 918, 919, 920, 921, 922, 923, 924, 925, 926, 927, 928, 929, 930, 931, 936, 937, 938, 944, 1523, 1524, 1525, 1526, 1528, 1530, 1531, 1532, 1533, 1534, 1535, 1536, 1537, 1538, 1539, 1540, 1541, 1559, 1560, 1561, 1562, 2196, 2197, 2198, 2199, 2201, 2202, 2203, 2204, 2205, 2206, 2207, 2208, 2209, 2210, 2211, 2212, 2213, 2214, 2215, 2216, 2217, 2218, 2219, 2220, 2221, 2222, 2223, 2224, 2226, 2228, 2229, 2230, 2245, 2246, 2850, 2853, 2854, 2857, 2858, 2859, 2860, 2861, 2862, 2863, 2864, 2865, 2866, 2867, 2868, 2869, 2870, ...], 'Edwards': [234, 235, 236, 237, 238, 239, 240, 241, 242, 243, 273, 274, 275, 276, 277, 278, 279, 280, 281, 282, 283, 284, 287, 762, 763, 764, 765, 766, 767, 783, 784, 786, 787, 788, 789, 790, 791, 792, 793, 794, 795, 796, 797, 798, 884, 885, 886, 887, 888, 889, 890, 891, 892, 893, 894, 895, 896, 897, 898, 899, 900, 901, 902, 903, 904, 1375, 1403, 1404, 1405, 1407, 1408, 1409, 1410, 1411, 1412, 1413, 1414, 1415, 1416, 1417, 1485, 1486, 1487, 1488, 1489, 1490, 1491, 1492, 1493, 1494, 1495, 1496, 1497, 1498, 1499, 1500, 1501, 1502, 1503, 1504, ...], 'Gilbert': [4, 5, 9, 10, 11, 12, 13, 16, 18, 51, 54, 55, 56, 57, 58, 344, 345, 346, 347, 348, 353, 354, 355, 356, 357, 358, 359, 360, 361, 362, 363, 364, 369, 464, 465, 466, 467, 474, 475, 476, 477, 478, 479, 480, 481, 483, 484, 485, 486, 487, 488, 489, 490, 491, 492, 493, 992, 993, 994, 995, 996, 997, 998, 1003, 1004, 1005, 1006, 1007, 1013, 1015, 1085, 1086, 1087, 1088, 1089, 1090, 1092, 1093, 1094, 1095, 1096, 1097, 1615, 1616, 1617, 1618, 1619, 1621, 1622, 1623, 1624, 1625, 1626, 1627, 1628, 1629, 1630, 1638, 1727, 1728, ...], 'Greens': [106, 107, 575, 1857, 2518, 2519, 2520, 2521], 'GrnHill': [2256, 2892], 'IDOTRR': [205, 206, 301, 302, 303, 304, 305, 306, 307, 726, 727, 754, 755, 758, 759, 760, 939, 940, 941, 942, 943, 945, 1359, 1360, 1361, 1362, 1363, 1364, 1365, 1368, 1369, 1370, 1544, 1545, 1546, 1547, 1548, 1549, 1550, 1551, 1552, 1553, 1554, 1555, 1556, 1557, 1558, 1610, 2030, 2031, 2032, 2033, 2034, 2035, 2036, 2037, 2038, 2039, 2043, 2231, 2232, 2233, 2234, 2235, 2236, 2237, 2238, 2239, 2240, 2241, 2242, 2243, 2244, 2669, 2690, 2691, 2692, 2693, 2694, 2695, 2696, 2697, 2872, 2873, 2874, 2875, 2876, 2877, 2878, 2879, 2880, 2881, 2882], 'Landmrk': [2788], 'MeadowV': [326, 327, 328, 329, 330, 331, 332, 973, 975, 977, 978, 979, 1593, 1594, 1595, 1596, 1597, 1599, 1600, 2283, 2284, 2285, 2286, 2287, 2288, 2289, 2290, 2908, 2909, 2910, 2913, 2914, 2916, 2917, 2918, 2919, 2920], 'Mitchel': [309, 310, 311, 312, 313, 322, 323, 324, 325, 333, 334, 335, 336, 337, 338, 339, 340, 946, 947, 948, 949, 950, 951, 952, 953, 954, 969, 970, 971, 972, 974, 976, 980, 981, 982, 983, 984, 985, 986, 987, 988, 1563, 1564, 1565, 1566, 1567, 1568, 1569, 1588, 1589, 1590, 1591, 1592, 1598, 1601, 1602, 1603, 1604, 1605, 1606, 1607, 1608, 1609, 2247, 2248, 2249, 2250, 2251, 2252, 2253, 2254, 2277, 2278, 2279, 2280, 2281, 2282, 2291, 2292, 2293, 2294, 2295, 2296, 2297, 2298, 2299, 2300, 2301, 2302, 2303, 2304, 2885, 2886, 2887, 2888, 2889, 2890, 2903, 2904, 2905, ...], 'NAmes': [0, 1, 2, 3, 23, 24, 25, 26, 27, 28, 117, 119, 120, 121, 122, 123, 124, 125, 126, 127, 128, 131, 132, 133, 134, 135, 136, 137, 138, 139, 140, 141, 142, 143, 144, 145, 146, 147, 148, 149, 150, 151, 152, 153, 154, 155, 156, 157, 159, 160, 161, 162, 163, 164, 165, 166, 167, 168, 341, 342, 343, 392, 393, 394, 395, 396, 397, 398, 399, 400, 401, 418, 419, 593, 594, 595, 599, 600, 601, 602, 603, 604, 605, 606, 607, 608, 609, 610, 611, 612, 613, 616, 617, 618, 619, 620, 621, 622, 623, 624, ...], 'NPkVill': [32, 33, 34, 35, 408, 409, 410, 411, 412, 413, 414, 415, 416, 417, 1046, 1047, 1048, 1680, 1681, 1682, 2373, 2376, 2377], 'NWAmes': [19, 20, 21, 110, 111, 112, 113, 114, 115, 116, 118, 370, 371, 372, 373, 374, 375, 376, 377, 378, 379, 380, 381, 382, 387, 388, 389, 390, 391, 579, 580, 581, 582, 583, 584, 585, 586, 587, 588, 589, 590, 591, 592, 596, 597, 598, 1016, 1017, 1018, 1019, 1020, 1021, 1022, 1023, 1024, 1025, 1026, 1027, 1028, 1029, 1030, 1031, 1032, 1185, 1186, 1187, 1188, 1189, 1190, 1191, 1197, 1198, 1199, 1200, 1201, 1203, 1643, 1644, 1645, 1646, 1647, 1648, 1649, 1650, 1651, 1652, 1653, 1654, 1655, 1656, 1657, 1658, 1659, 1660, 1661, 1863, 1864, 1865, 1866, 1867, ...], 'NoRidge': [59, 60, 61, 62, 63, 64, 65, 90, 91, 92, 494, 495, 496, 497, 498, 499, 500, 501, 502, 503, 504, 505, 564, 1098, 1099, 1100, 1101, 1102, 1103, 1104, 1105, 1106, 1107, 1108, 1109, 1157, 1158, 1760, 1761, 1762, 1763, 1764, 1765, 1766, 1767, 1768, 1769, 1770, 1771, 1772, 1773, 1774, 1832, 1833, 2442, 2443, 2444, 2445, 2446, 2447, 2448, 2449, 2450, 2451, 2452, 2453, 2499, 2500, 2501, 2502, 2503], 'NridgHt': [36, 37, 38, 39, 40, 41, 42, 43, 44, 45, 46, 47, 48, 49, 50, 420, 421, 422, 423, 424, 425, 426, 427, 428, 429, 430, 431, 432, 433, 434, 435, 436, 437, 438, 439, 440, 441, 442, 443, 444, 445, 446, 447, 448, 449, 450, 451, 452, 453, 454, 455, 456, 457, 458, 459, 460, 461, 462, 463, 482, 1050, 1051, 1052, 1053, 1054, 1055, 1056, 1057, 1058, 1059, 1060, 1061, 1062, 1063, 1064, 1065, 1066, 1067, 1068, 1069, 1070, 1071, 1072, 1073, 1074, 1075, 1076, 1077, 1078, 1079, 1091, 1684, 1685, 1686, 1687, 1688, 1689, 1690, 1691, 1692, ...], 'OldTown': [158, 169, 170, 171, 172, 173, 174, 175, 176, 177, 178, 179, 180, 181, 182, 183, 184, 185, 186, 187, 188, 189, 190, 200, 201, 202, 203, 204, 207, 650, 654, 655, 656, 657, 658, 659, 660, 661, 662, 663, 664, 665, 691, 692, 693, 694, 695, 696, 697, 698, 699, 700, 701, 702, 703, 704, 705, 706, 707, 708, 709, 710, 711, 712, 713, 714, 715, 716, 717, 718, 719, 720, 721, 722, 723, 724, 725, 749, 750, 751, 752, 753, 756, 757, 1254, 1255, 1257, 1258, 1259, 1283, 1284, 1285, 1286, 1287, 1288, 1289, 1290, 1291, 1292, 1293, ...], 'SWISU': [211, 212, 213, 214, 285, 286, 288, 289, 290, 291, 292, 905, 906, 907, 908, 909, 910, 911, 913, 914, 916, 1515, 1516, 1517, 1518, 1519, 1520, 1521, 1522, 1527, 1529, 2047, 2080, 2194, 2195, 2200, 2703, 2704, 2842, 2845, 2846, 2847, 2848, 2849, 2851, 2852, 2855, 2856], 'Sawyer': [83, 84, 85, 86, 87, 88, 89, 108, 215, 216, 217, 218, 219, 220, 221, 222, 223, 224, 225, 226, 227, 230, 231, 554, 555, 556, 557, 558, 559, 560, 561, 562, 578, 761, 768, 769, 770, 771, 772, 773, 774, 775, 776, 777, 778, 780, 1149, 1150, 1151, 1152, 1153, 1154, 1156, 1371, 1372, 1373, 1376, 1377, 1378, 1379, 1380, 1381, 1382, 1383, 1384, 1385, 1386, 1387, 1388, 1389, 1390, 1391, 1393, 1394, 1396, 1397, 1818, 1819, 1820, 1821, 1822, 1823, 1824, 1825, 1826, 1829, 1830, 1831, 1861, 2044, 2048, 2049, 2050, 2051, 2052, 2053, 2054, 2055, 2056, 2057, ...], 'SawyerW': [72, 73, 74, 75, 76, 77, 78, 79, 80, 81, 82, 244, 245, 246, 247, 248, 253, 254, 533, 534, 535, 536, 537, 538, 539, 540, 541, 542, 543, 544, 545, 546, 547, 548, 549, 550, 551, 552, 553, 799, 800, 801, 802, 803, 804, 805, 806, 807, 808, 809, 810, 811, 812, 813, 814, 815, 816, 817, 832, 1131, 1132, 1133, 1134, 1135, 1136, 1137, 1138, 1139, 1140, 1141, 1142, 1143, 1144, 1145, 1146, 1147, 1148, 1418, 1419, 1420, 1421, 1422, 1427, 1428, 1806, 1807, 1808, 1809, 1810, 1811, 1812, 1813, 1814, 1815, 1816, 1817, 2089, 2090, 2091, 2092, ...], 'Somerst': [22, 66, 67, 68, 69, 70, 71, 93, 94, 95, 96, 97, 98, 99, 100, 101, 102, 103, 104, 105, 109, 383, 384, 385, 386, 506, 507, 508, 509, 510, 511, 512, 513, 514, 515, 516, 517, 518, 519, 520, 521, 522, 523, 524, 525, 526, 527, 528, 529, 530, 531, 532, 565, 566, 567, 568, 569, 570, 571, 572, 573, 1110, 1111, 1112, 1113, 1114, 1115, 1116, 1117, 1118, 1119, 1120, 1121, 1122, 1123, 1124, 1125, 1126, 1127, 1128, 1129, 1130, 1159, 1160, 1161, 1162, 1163, 1164, 1165, 1166, 1167, 1168, 1169, 1170, 1171, 1172, 1173, 1174, 1175, 1176, ...], 'StoneBr': [6, 7, 8, 14, 15, 17, 349, 350, 351, 352, 365, 366, 367, 368, 999, 1000, 1001, 1002, 1008, 1009, 1010, 1011, 1012, 1014, 1620, 1631, 1632, 1633, 1634, 1635, 1636, 1637, 1639, 1640, 1641, 1642, 2322, 2326, 2327, 2328, 2329, 2330, 2331, 2332, 2333, 2334, 2335, 2336, 2339, 2340, 2341], 'Timber': [314, 315, 316, 317, 318, 319, 320, 321, 955, 956, 957, 958, 959, 960, 961, 962, 963, 964, 965, 966, 967, 968, 1570, 1571, 1572, 1573, 1574, 1575, 1576, 1577, 1578, 1579, 1580, 1581, 1582, 1583, 1584, 1585, 1586, 1587, 2255, 2257, 2258, 2259, 2260, 2261, 2262, 2263, 2264, 2265, 2266, 2267, 2268, 2269, 2270, 2271, 2272, 2273, 2274, 2275, 2276, 2891, 2893, 2894, 2895, 2896, 2897, 2898, 2899, 2900, 2901, 2902], 'Veenker': [563, 574, 576, 577, 1155, 1178, 1179, 1180, 1181, 1182, 1183, 1827, 1828, 1853, 1854, 1855, 1856, 1858, 1859, 1860, 2498, 2516, 2517, 2522]}

And access a specific group:

# Get the Bloomington neighborhood group
ames_grp.get_group('Blmngtn').head()
Order PID MS SubClass MS Zoning Lot Frontage Lot Area Street Alley Lot Shape Land Contour ... Pool Area Pool QC Fence Misc Feature Misc Val Mo Sold Yr Sold Sale Type Sale Condition SalePrice
52 53 528228285 120 RL 43.0 3203 Pave NaN Reg Lvl ... 0 NaN NaN NaN 0 1 2010 WD Normal 160000
53 54 528228440 120 RL 43.0 3182 Pave NaN Reg Lvl ... 0 NaN NaN NaN 0 4 2010 WD Normal 192000
468 469 528228290 120 RL 53.0 3684 Pave NaN Reg Lvl ... 0 NaN NaN NaN 0 6 2009 WD Normal 174000
469 470 528228295 120 RL 51.0 3635 Pave NaN Reg Lvl ... 0 NaN NaN NaN 0 5 2009 WD Normal 175900
470 471 528228435 120 RL 43.0 3182 Pave NaN Reg Lvl ... 0 NaN NaN NaN 0 5 2009 WD Normal 192500

5 rows × 82 columns

Applying Aggregations to Groups

Once a group is defined, you can apply the same aggregation methods we used earlier:

ames.groupby('Neighborhood').agg({'SalePrice': ['mean', 'median']}).head()
SalePrice
mean median
Neighborhood
Blmngtn 196661.678571 191500.0
Blueste 143590.000000 130500.0
BrDale 105608.333333 106000.0
BrkSide 124756.250000 126750.0
ClearCr 208662.090909 197500.0

This returns a DataFrame where each row corresponds to a different neighborhood, and the columns represent the aggregated values.

Groups as Index vs. Variables

By default, the grouped variable becomes the index of the resulting DataFrame.

ames.groupby('Neighborhood').agg({'SalePrice': ['mean', 'median']}).index
Index(['Blmngtn', 'Blueste', 'BrDale', 'BrkSide', 'ClearCr', 'CollgCr',
       'Crawfor', 'Edwards', 'Gilbert', 'Greens', 'GrnHill', 'IDOTRR',
       'Landmrk', 'MeadowV', 'Mitchel', 'NAmes', 'NPkVill', 'NWAmes',
       'NoRidge', 'NridgHt', 'OldTown', 'SWISU', 'Sawyer', 'SawyerW',
       'Somerst', 'StoneBr', 'Timber', 'Veenker'],
      dtype='object', name='Neighborhood')

This is the most efficient default behavior in Pandas. However, if you’d prefer the group column to remain a regular column instead of becoming the index, you can set as_index=False:

ames.groupby('Neighborhood', as_index=False).agg({'SalePrice': ['mean', 'median']}).head()
Neighborhood SalePrice
mean median
0 Blmngtn 196661.678571 191500.0
1 Blueste 143590.000000 130500.0
2 BrDale 105608.333333 106000.0
3 BrkSide 124756.250000 126750.0
4 ClearCr 208662.090909 197500.0

Using as_index=False can make your results easier to merge with other DataFrames or write to CSV later.

Grouping by Multiple Variables

You can also group by more than one variable. For example, to compute the average sale price by both Neighborhood and Yr Sold:

ames.groupby(['Neighborhood', 'Yr Sold'], as_index=False).agg({'SalePrice': 'mean'})
Neighborhood Yr Sold SalePrice
0 Blmngtn 2006 214424.454545
1 Blmngtn 2007 194671.500000
2 Blmngtn 2008 190714.400000
3 Blmngtn 2009 177266.666667
4 Blmngtn 2010 176000.000000
... ... ... ...
125 Timber 2010 224947.625000
126 Veenker 2006 270000.000000
127 Veenker 2007 253577.777778
128 Veenker 2008 225928.571429
129 Veenker 2009 253962.500000

130 rows × 3 columns

This returns one row for each combination of Neighborhood and Yr Sold, giving you more granular insights.

Knowledge check

NoneTry it yourself:
  1. Reframe the following question using Pandas’ grouped aggregation syntax. Which Pandas functions will you need?

    What is the average above-ground square footage of homes, grouped by neighborhood and number of bedrooms?

  2. Now compute the result using the Ames Housing dataset. 🔍 Hint…

    • Gr Liv Area = above-ground square footage
    • Neighborhood = neighborhood name
    • Bedroom AbvGr = number of bedrooms
  3. Using your results from #2, identify any neighborhoods where 1-bedroom homes have an average of more than 1500 square feet above ground. How many neighborhoods meet this condition?

11.3 Summary

In this chapter, we explored how to summarize and aggregate data using Pandas—a foundational skill in any data analysis workflow. You learned how to compute summary statistics on individual columns (Series), multiple columns in a DataFrame, and across groups using the powerful groupby() method. We introduced tools like .mean(), .median(), .describe(), and .agg() to help extract key insights from both numerical and categorical variables. These techniques allow us to make sense of large datasets by reducing complexity and identifying trends, patterns, and outliers.

In the chapters ahead, we’ll continue building on these data wrangling skills. You’ll learn how to combine datasets using joins, reshape data through pivoting and tidying, and prepare data for modeling and visualization. Mastering these techniques will give you the ability to transform raw data into a clean, structured form ready for deeper analysis.

11.4 Exercise: Aggregating COVID College Data

Now that you’ve practiced subsetting and filtering, let’s dig deeper by computing some summary statistics from the college COVID-19 dataset.

import pandas as pd

data_url = "https://raw.githubusercontent.com/nytimes/covid-19-data/refs/heads/master/colleges/colleges.csv"
college_df = pd.read_csv(data_url)
college_df.head()
date state county city ipeds_id college cases cases_2021 notes
0 2021-05-26 Alabama Madison Huntsville 100654 Alabama A&M University 41 NaN NaN
1 2021-05-26 Alabama Montgomery Montgomery 100724 Alabama State University 2 NaN NaN
2 2021-05-26 Alabama Limestone Athens 100812 Athens State University 45 10.0 NaN
3 2021-05-26 Alabama Lee Auburn 100858 Auburn University 2742 567.0 NaN
4 2021-05-26 Alabama Montgomery Montgomery 100830 Auburn University at Montgomery 220 80.0 NaN
  • What function will help you find the average (mean) value of a column?
  • What is the average value of cases?
college_df['cases'].____()
  • What is the average value of cases?
  • How do these two numbers compare? Why might they be different? Hint: Read the variable definitions in the NYT GitHub repo. Are these columns measuring the same thing?
college_df[['cases', 'cases_2021']].____()
  • Use groupby() and sum() to find the total cases reported by colleges in each state.
  • Which state had the most cases?
  • Which had the fewest?
college_df.groupby('state')[['cases']].____()

Filter the data to show only colleges in Ohio. Then compute:

  • The total number of cases
  • The average (mean) number of cases across Ohio colleges
ohio_df = college_df[college_df['state'] == '____']

# Your aggregations go here